Observability guide
Observability with Grafana
Accessing Telemetry Data in Grafana
Accessing Grafana Dashboards
-
Navigate to the Grafana web interface at:
-
Log in using the administrator credentials configured in your
grafana.iniconfiguration file. -
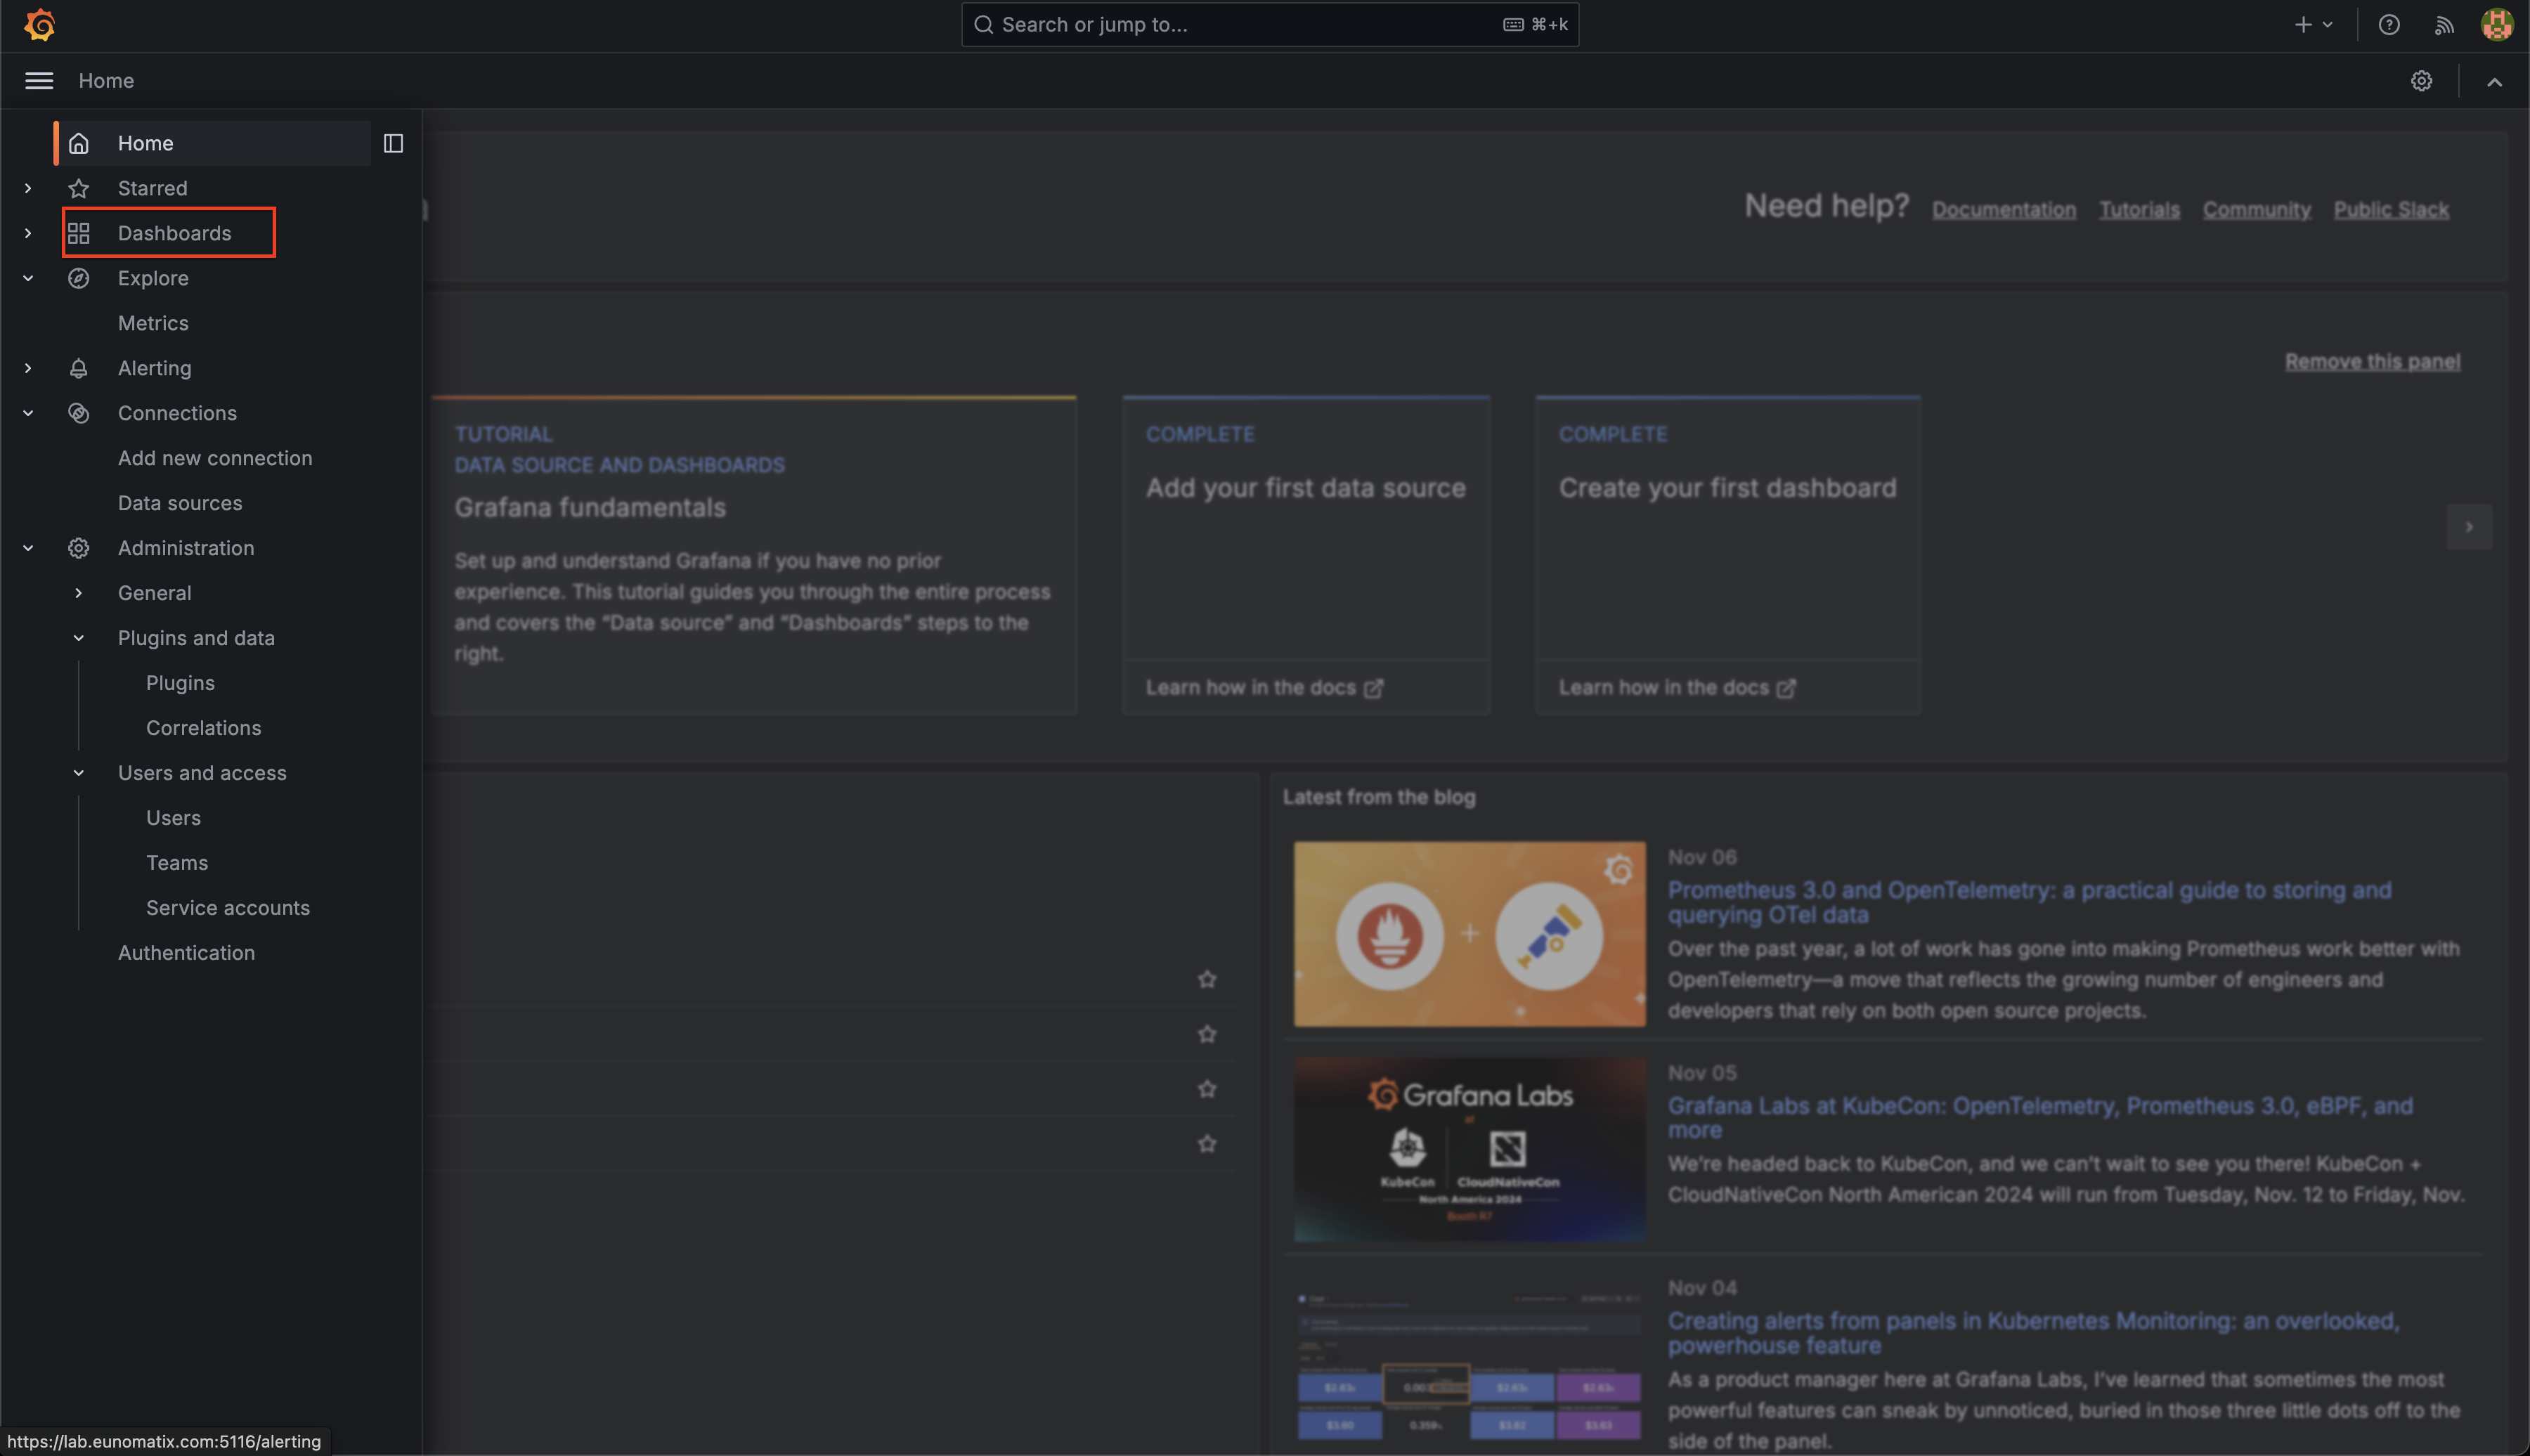
From the left navigation sidebar, select "Dashboards" to view available dashboard options.
-
Locate and open the "LLM-Inspect" dashboard, which provides comprehensive observability and traceability metrics for the system.
Analyzing OpenTelemetry Traces
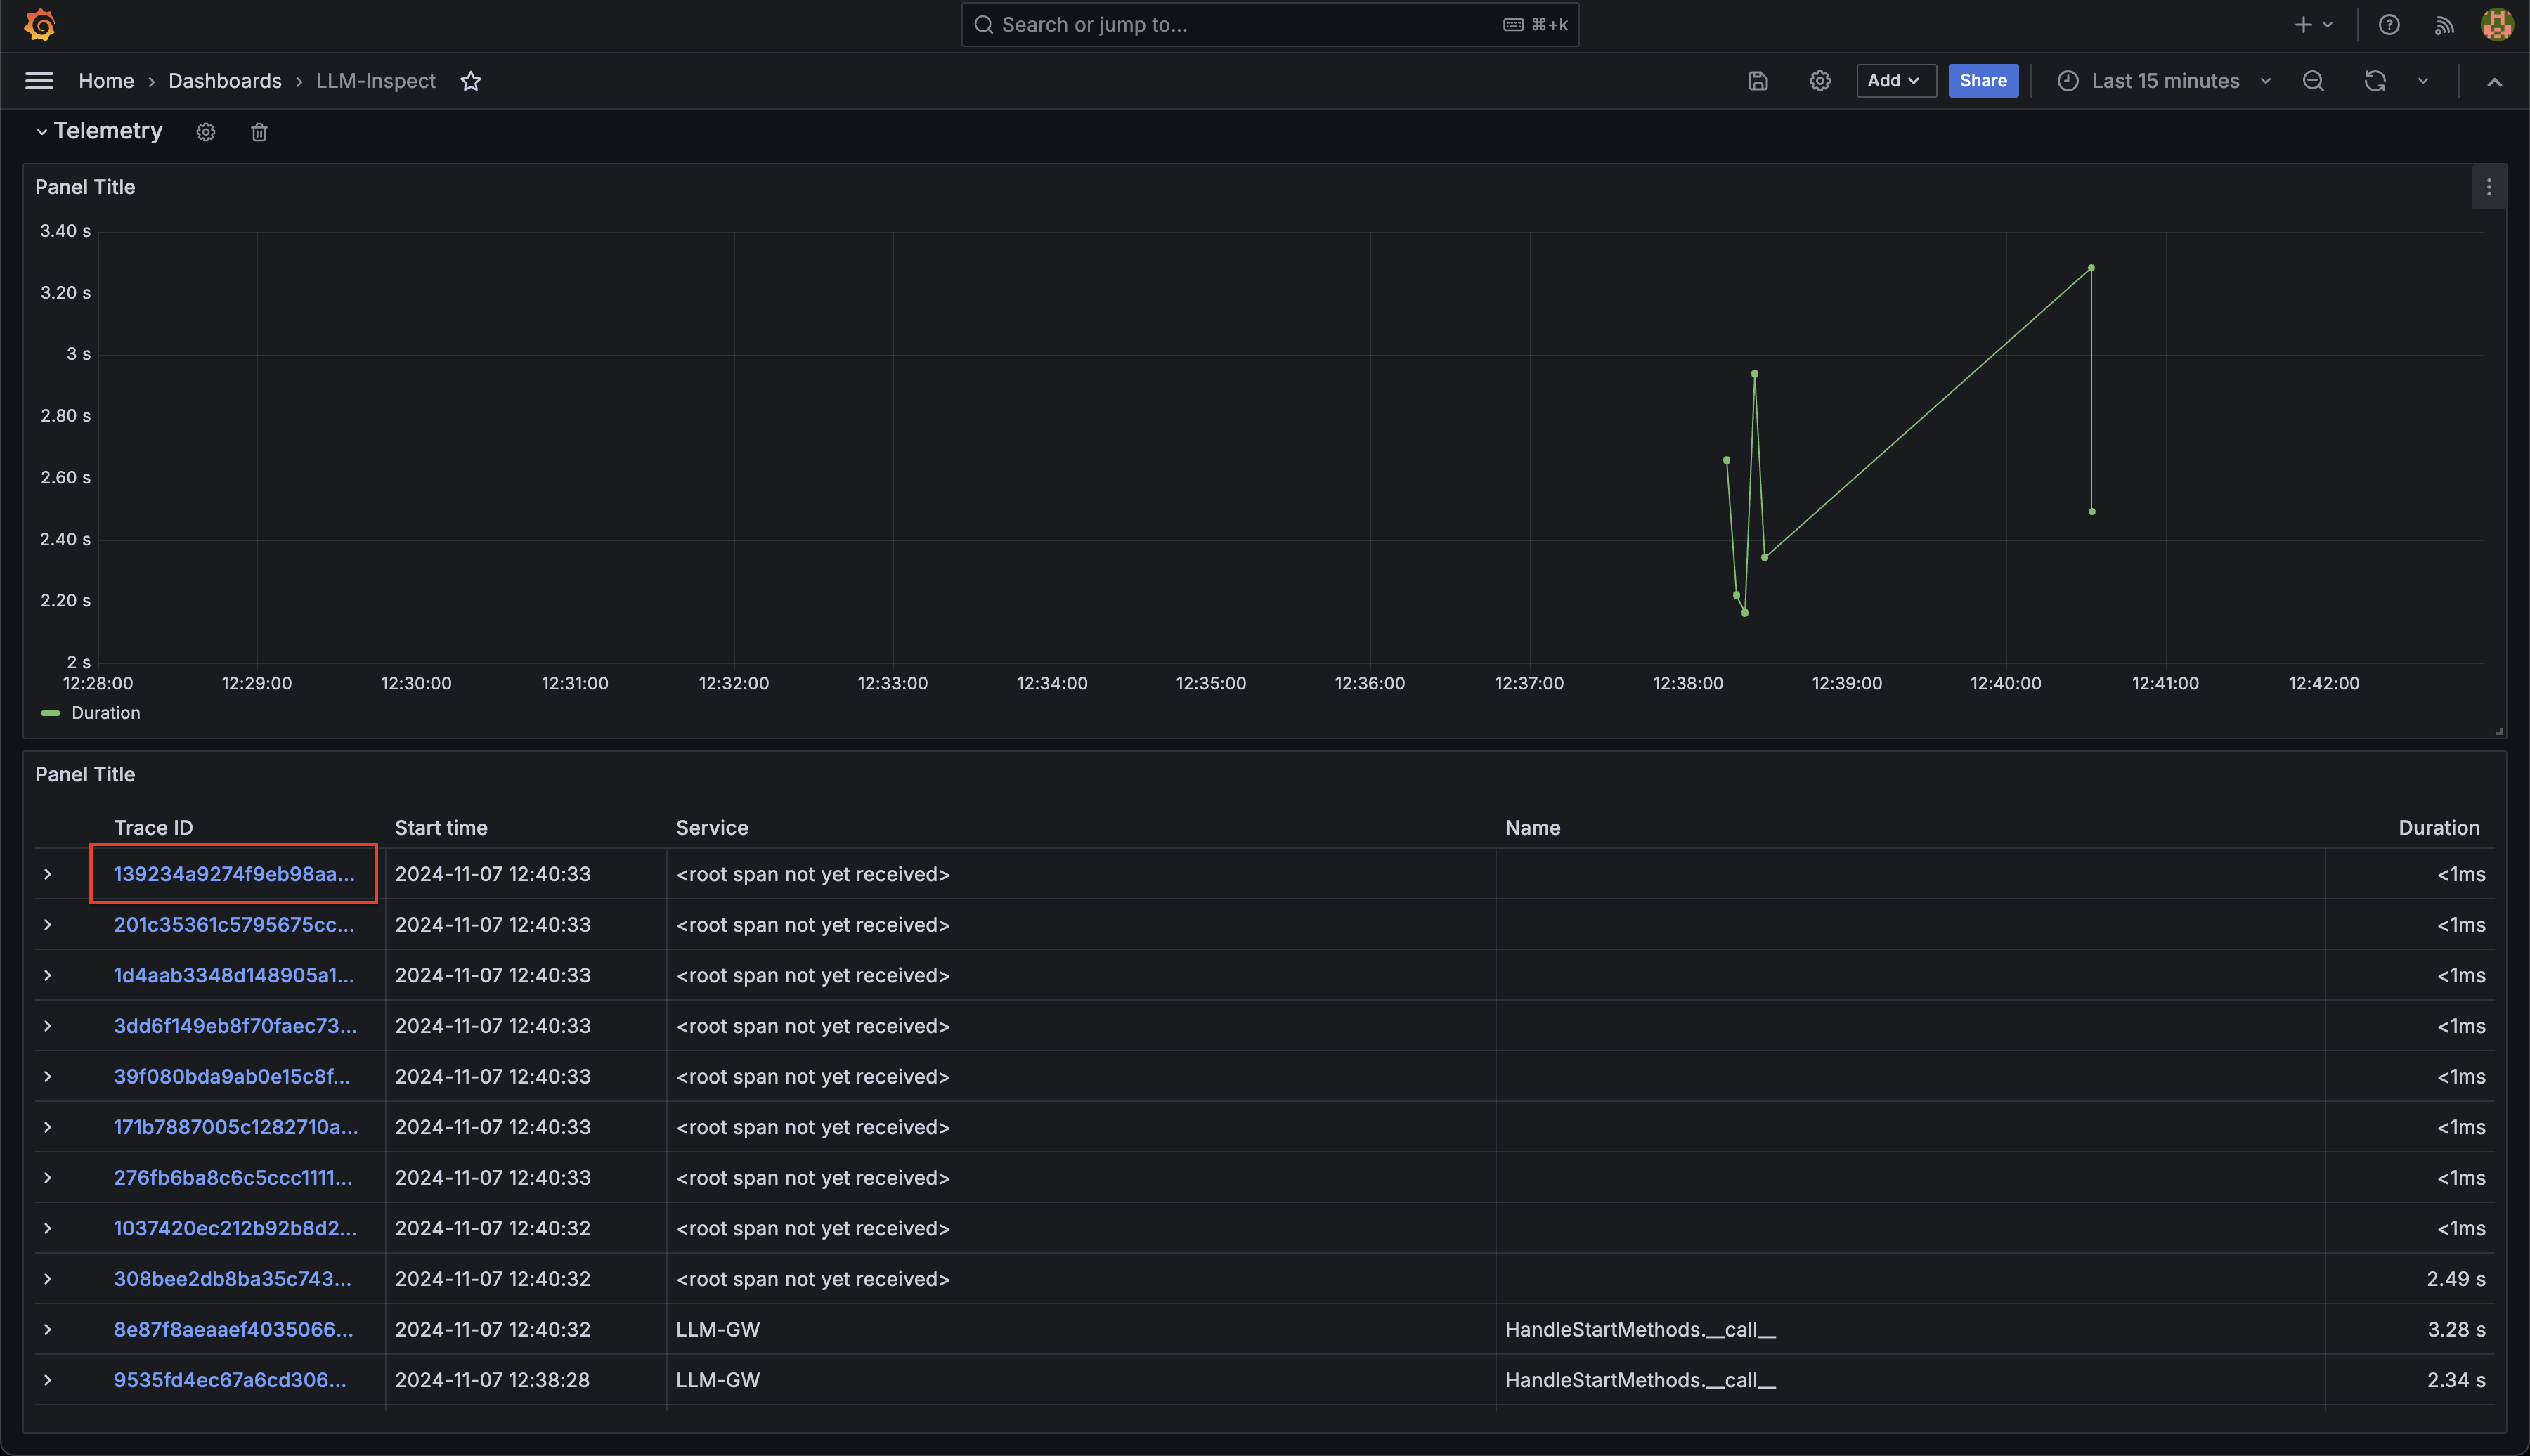
The LLM-Inspect dashboard includes a dedicated Telemetry section that enables detailed trace analysis:
- Within the Telemetry row, you'll find:
- A time-series graph showing trace metrics over time
- A detailed table listing all captured traces with associated metadata
-
Each trace entry in the table contains a clickable trace ID. These IDs serve as unique identifiers for individual request traces.
-
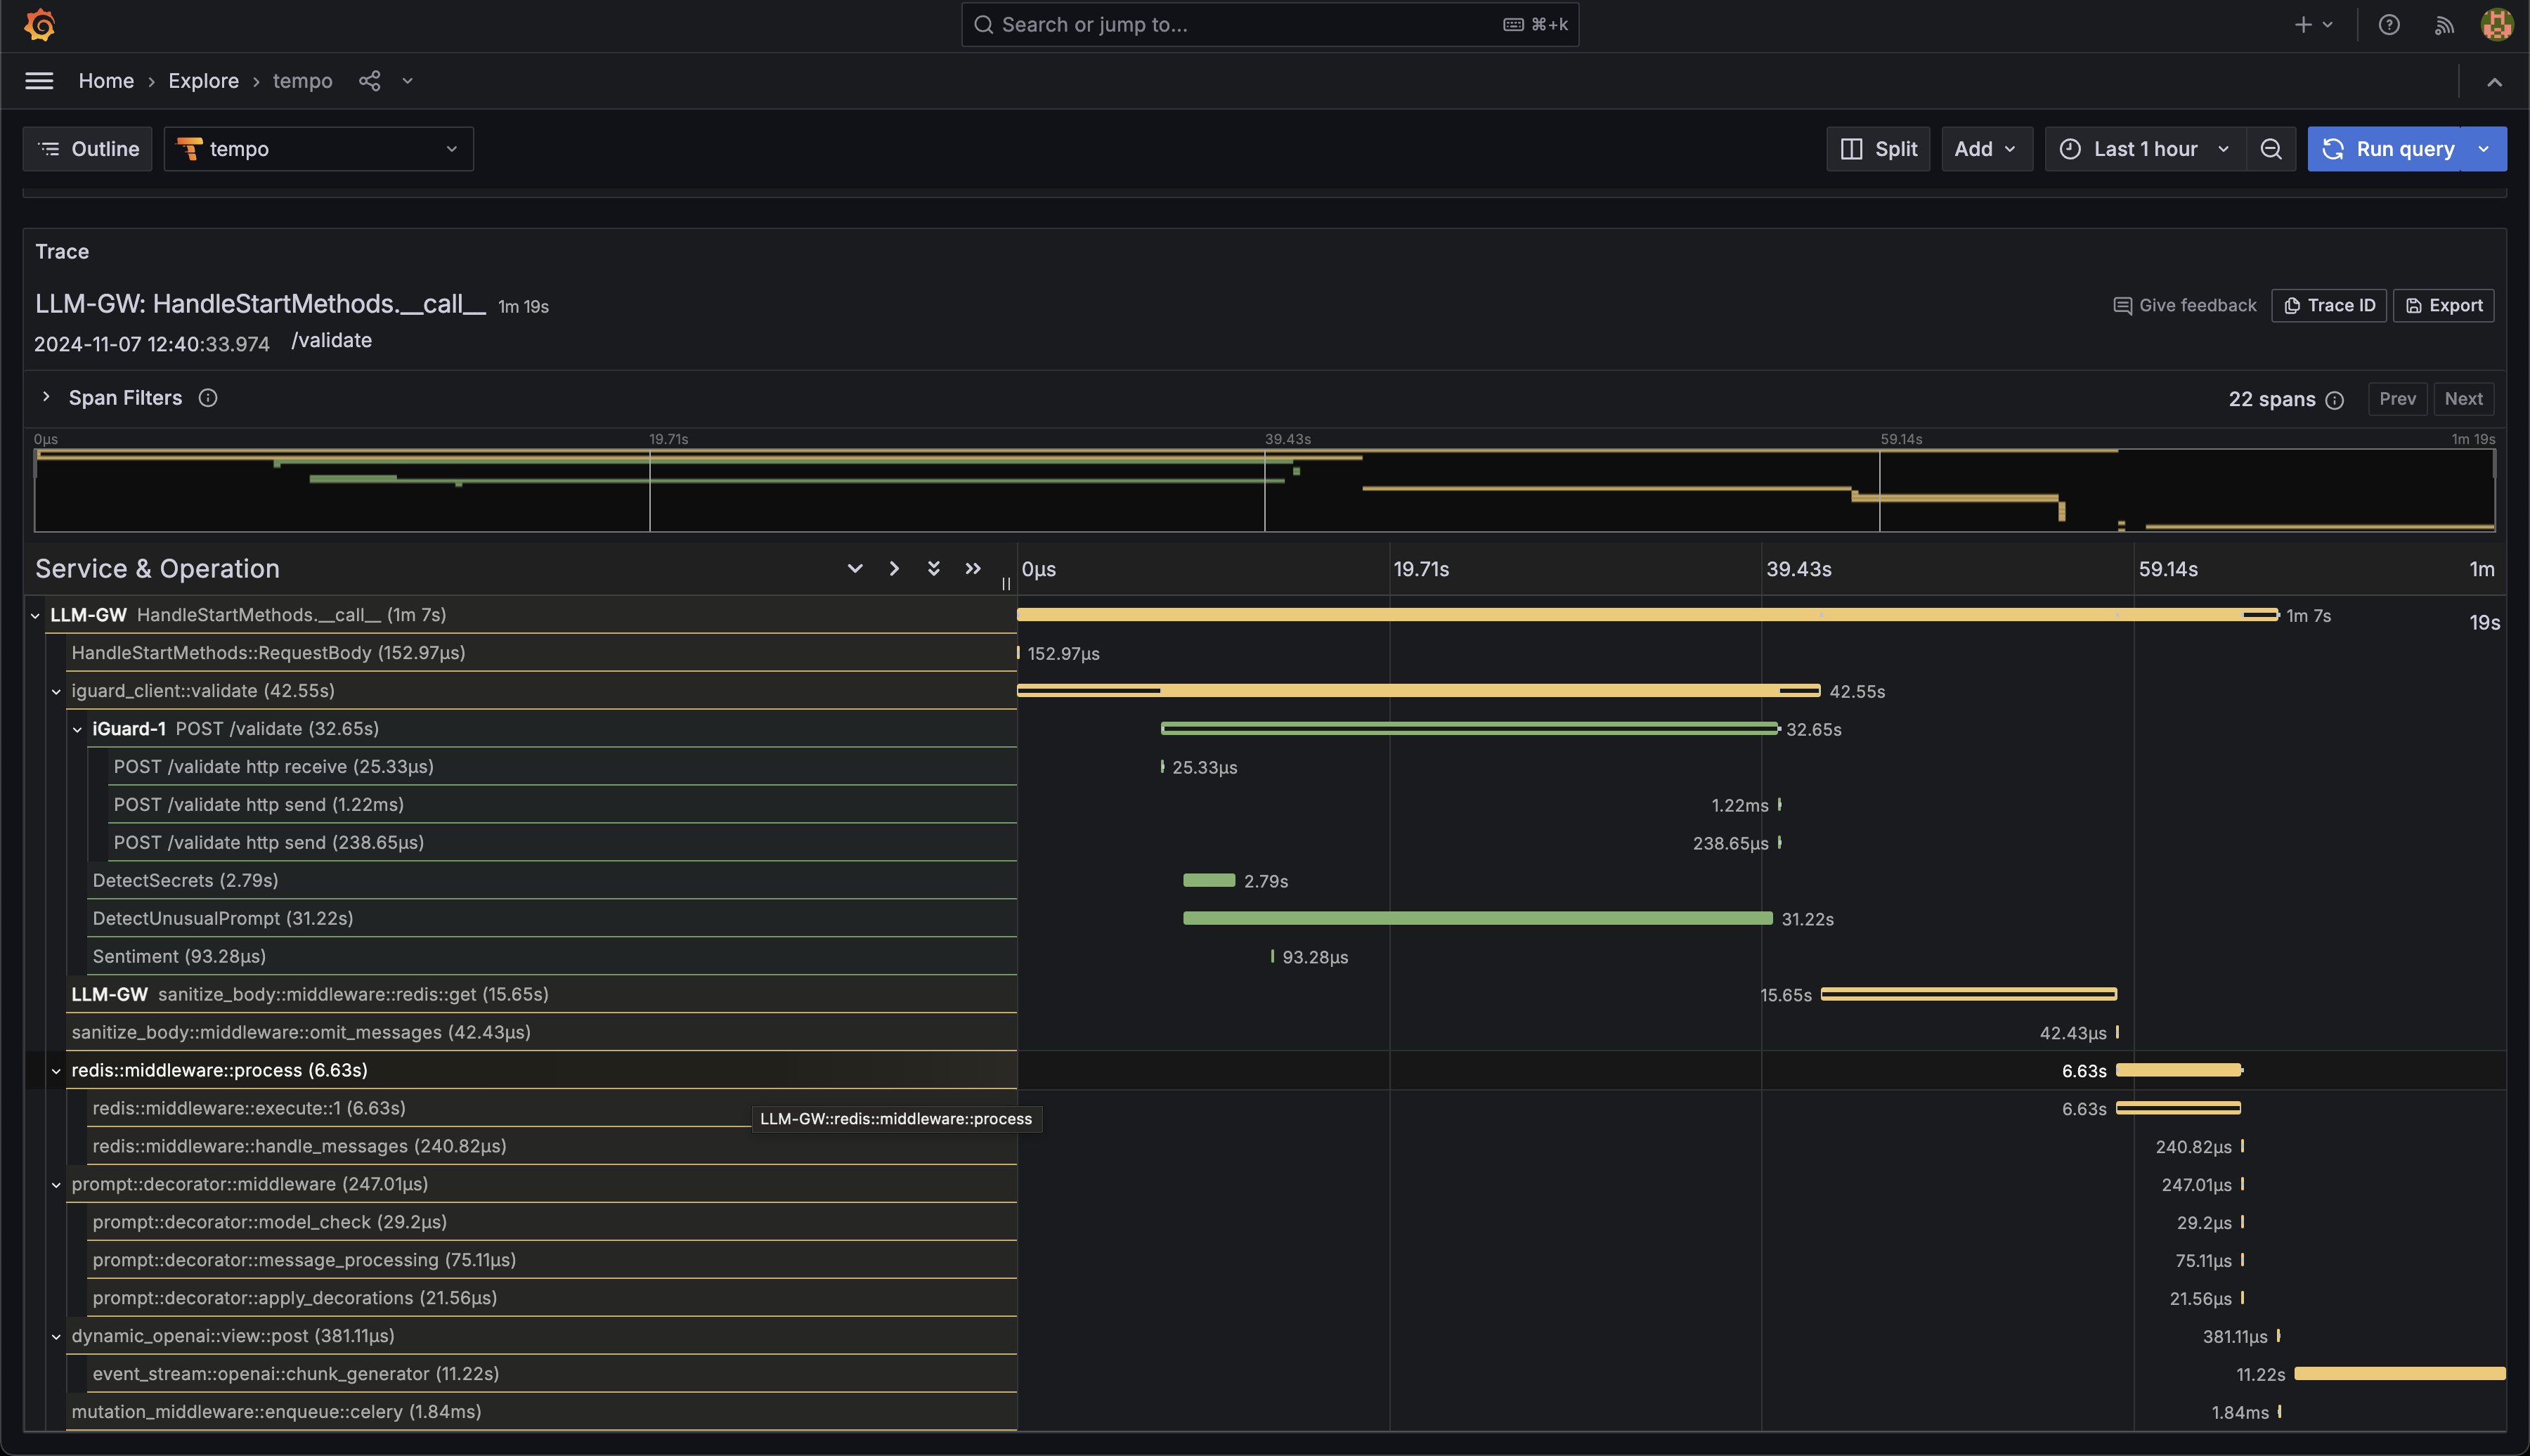
Clicking a trace ID reveals a detailed view of the request journey, including:
- Complete request path through system services
- Individual span information and timing
- Associated span attributes and metadata
- Service dependencies and interactions
-
You can also view the span attributes for detail debugging and observability.
For examle this span shows the request body and headers as they land on the
LLM-GWserver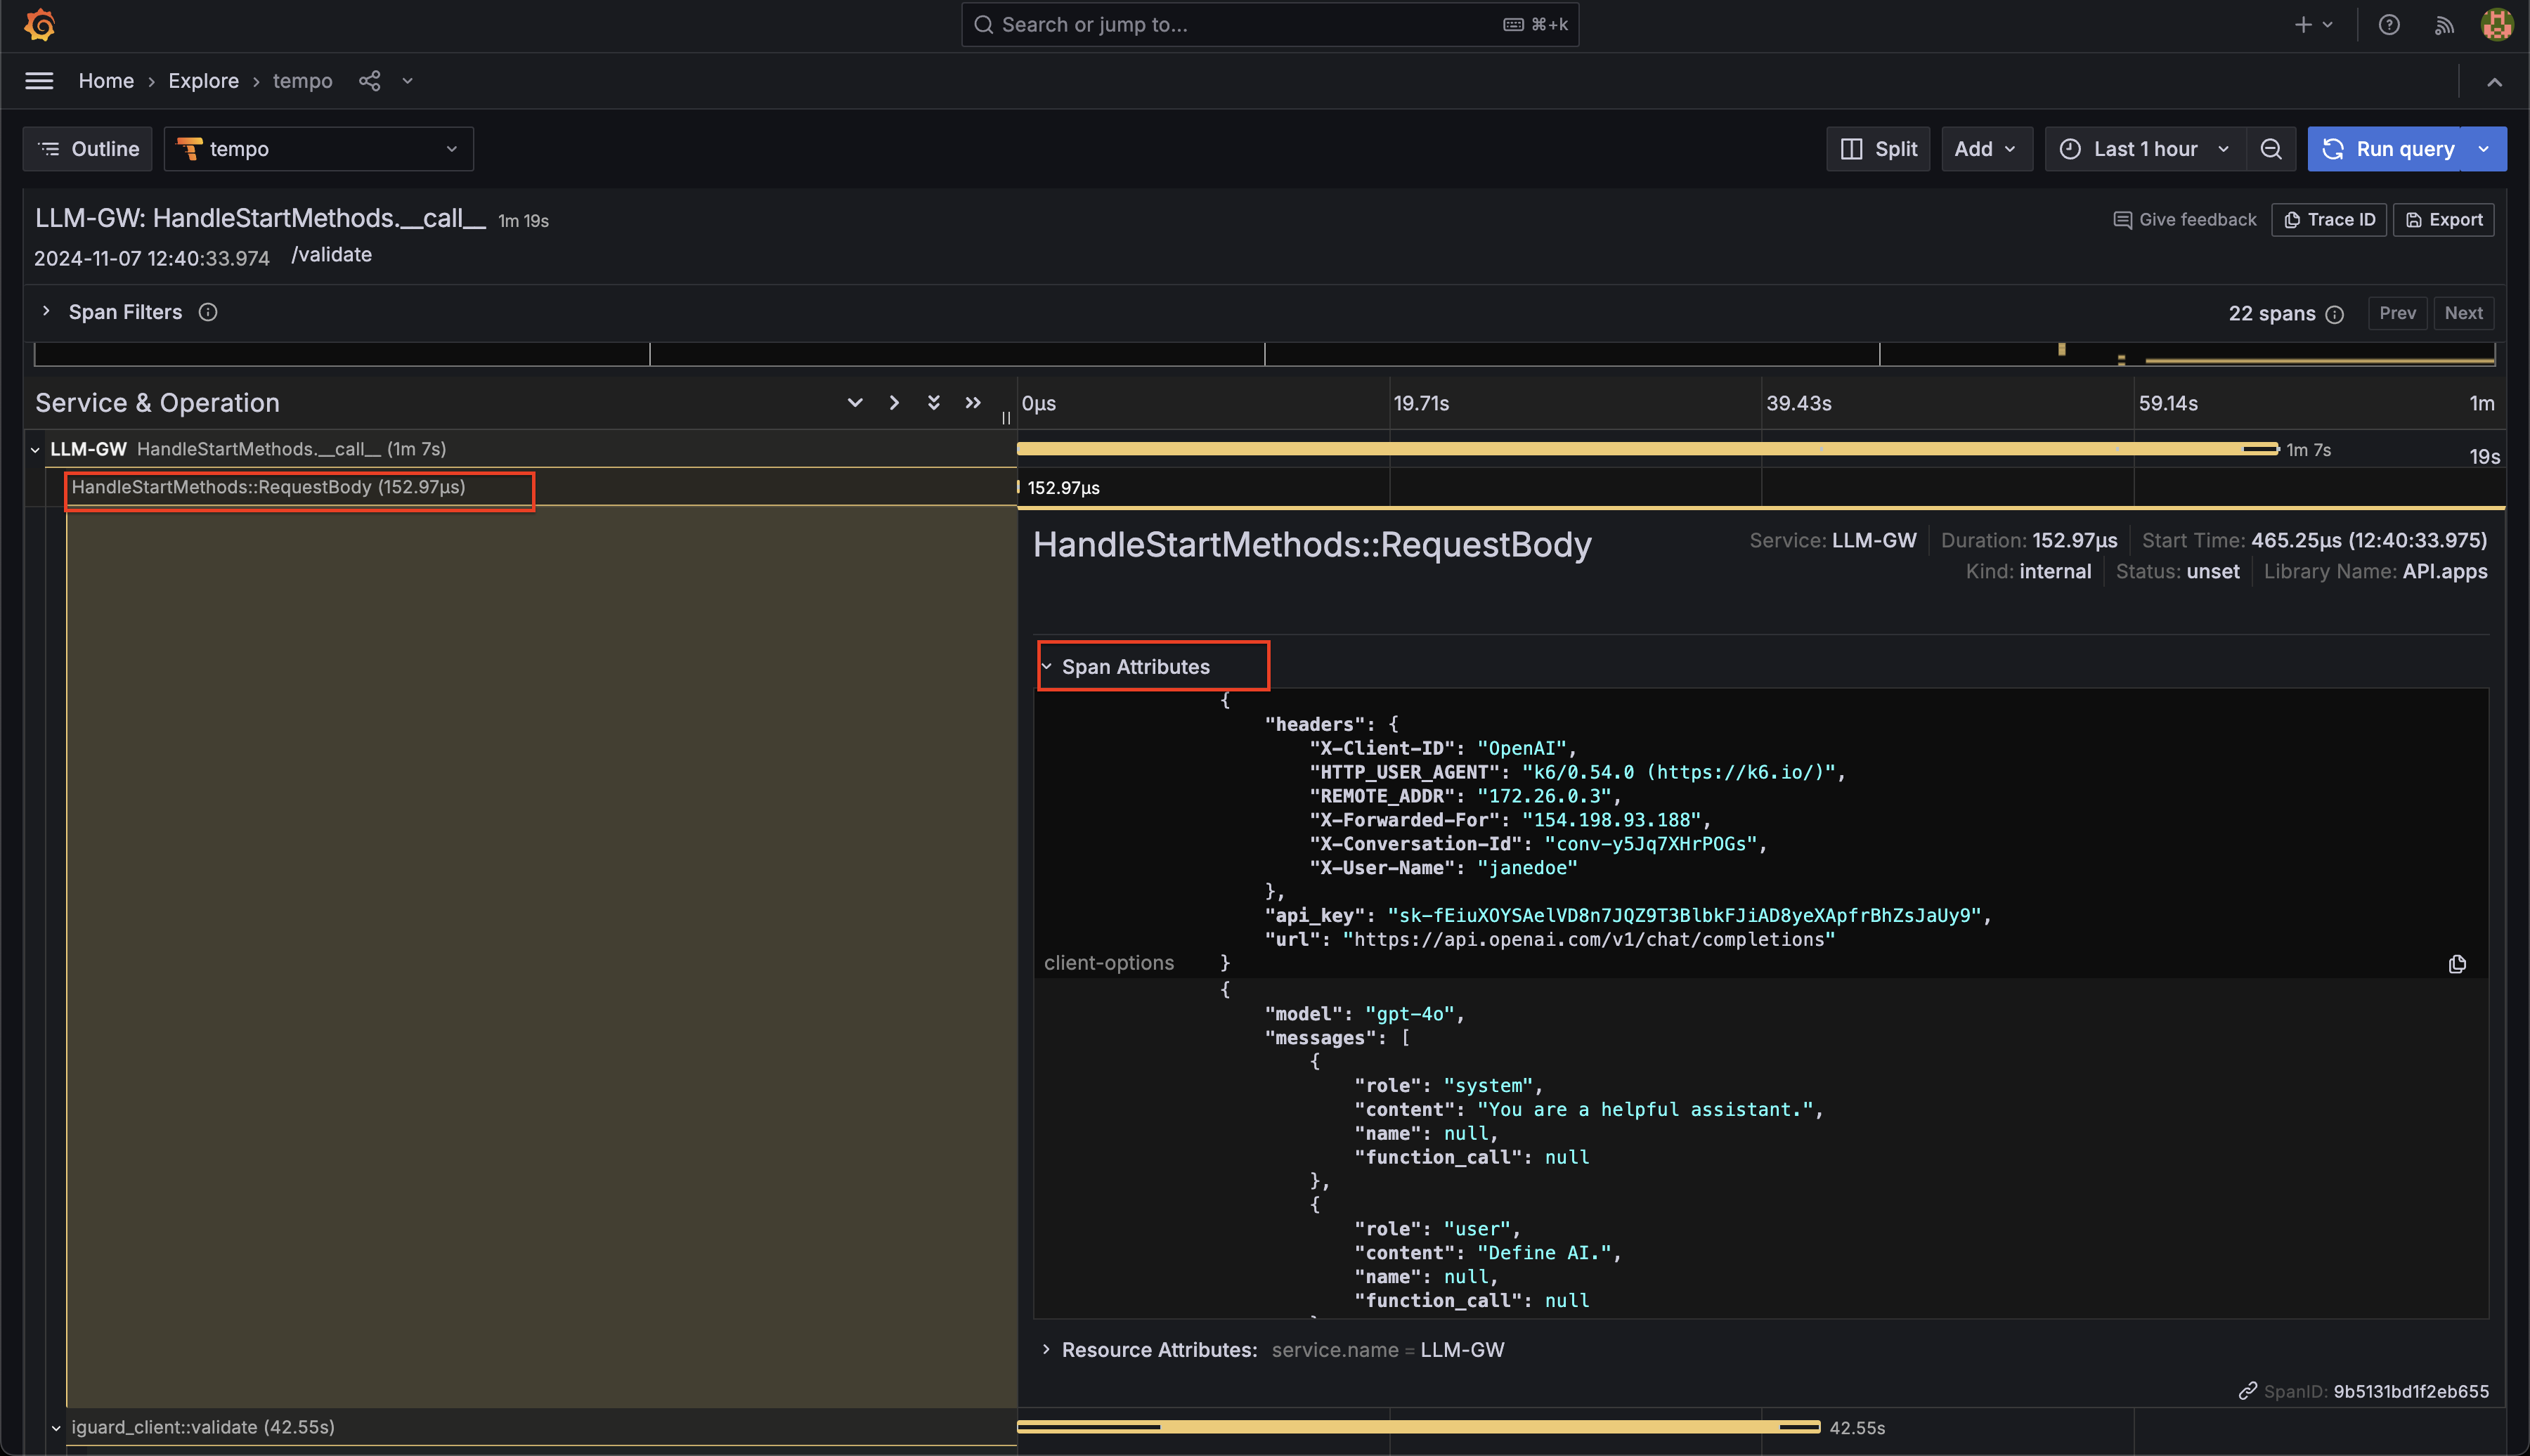
This trace visualization allows administrators to: - Track request flow across distributed services - Identify performance bottlenecks - Debug service interactions - Monitor system behavior and health
These telemetry insights are crucial for maintaining optimal system performance and quickly resolving any issues that may arise.
Monitoring User Interactions
Access user activity dashboard: - Message counts - Token usage - Failed validations - Response times