Usage Overview
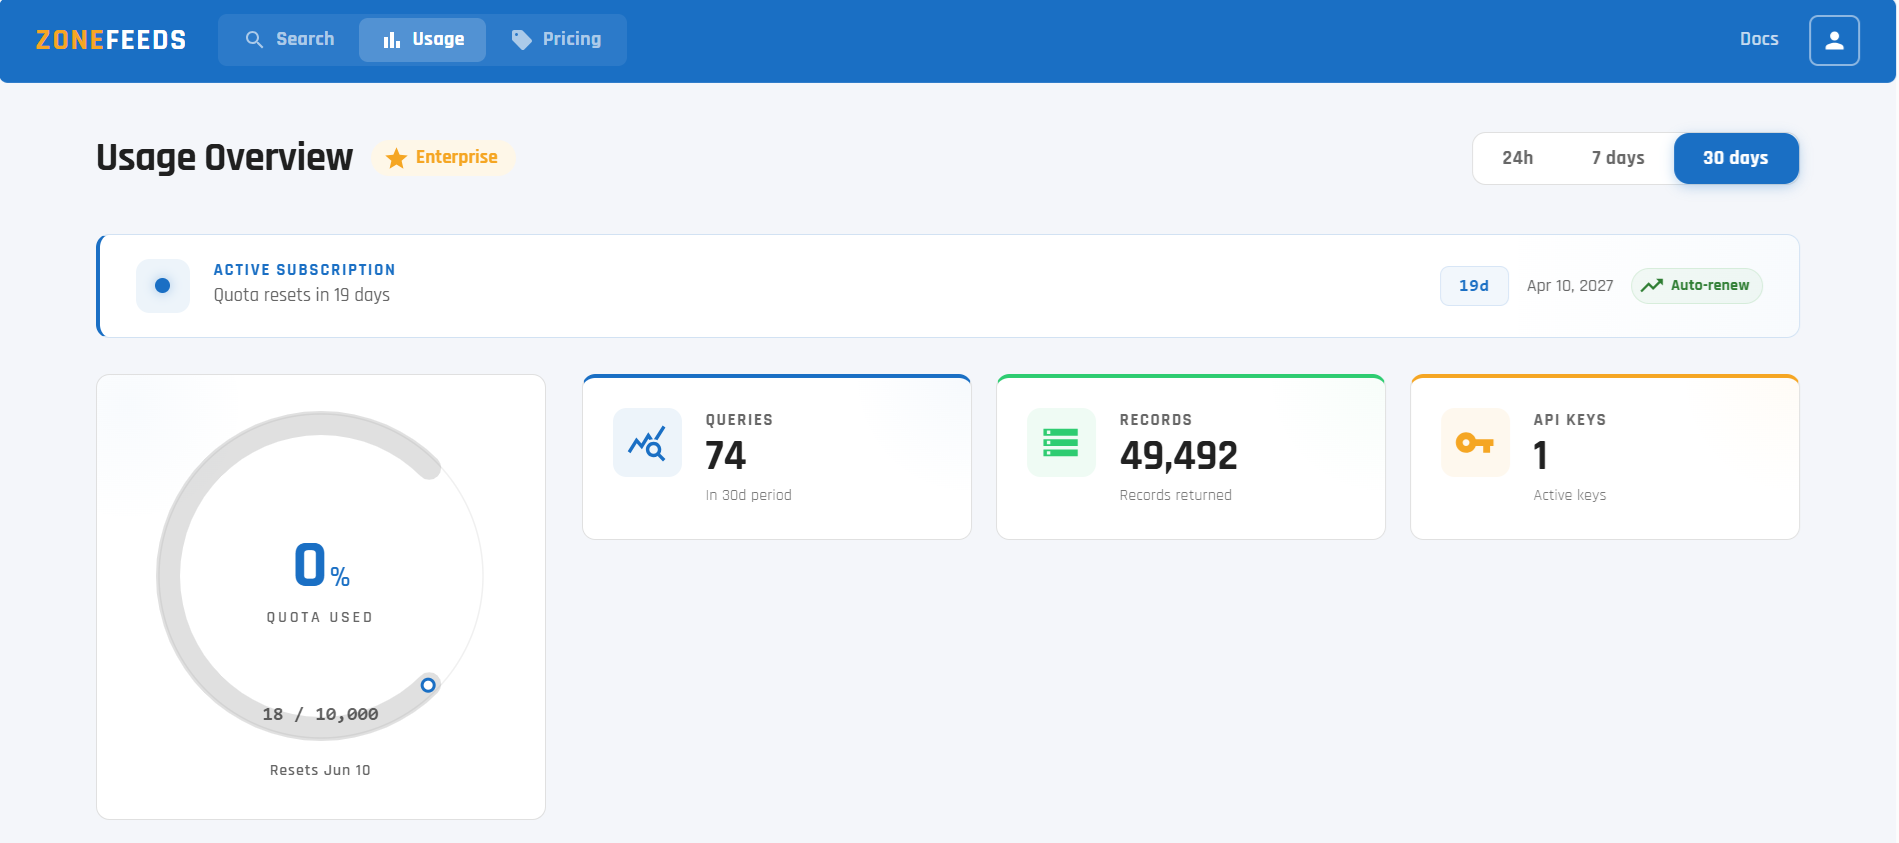
The Usage Overview dashboard is your single pane of glass for tracking how you are using ZoneFeeds — quota consumption, query history, API key activity, top TLDs, and subscription status are all surfaced in one place.
The page is available to all subscribers, including users on the Trial plan.
How to open it: Click your user menu in the top-right of the app and select Usage Overview (or navigate to the Usage tab from the main navigation bar).
Time Range Selector
The toggle in the top-right of the dashboard controls the rolling window used for every metric, chart, and history table on the page.
| Option | Description |
|---|---|
| 24h | Activity from the last 24 hours |
| 7 days | Activity from the last 7 days |
| 30 days | Activity from the last 30 days (default) |
Switching ranges updates every panel on the page in place — no need to refresh.
Note: ZoneFeeds retains usage activity for one month. Selecting 30 days shows the full retained window. Older activity is automatically deleted in line with our data retention policy (see Terms & Conditions).
Active Subscription Card
The top banner summarises your current subscription at a glance.
| Field | Description |
|---|---|
| Plan badge | Your current plan tier (Trial, Basic, or Enterprise) |
| Quota status | How many days remain until your monthly quota resets |
| Renewal date | The date your subscription auto-renews or expires |
| Auto-renew | Link to manage auto-renewal — toggle it off to stop billing at the end of the current period |
For full subscription management (upgrading, cancelling, resubscribing), see the Subscription Guide.
Key Metric Tiles
Four tiles sit directly below the subscription card and summarise your usage for the selected time range.
Quota Used
A ring chart showing the percentage of your monthly query quota consumed.
- The centre value shows the percentage used (e.g.
0%) - Beneath it: queries used vs. your plan limit (e.g.
18 / 10,000) - Footer: the date your quota resets
Quota resets monthly on the day of the month you subscribed.
Queries
Total number of queries executed in the selected time range.
This counts billable queries only — cursor-based pagination requests (continuation pages of the same search) do not count toward your quota and are not included here. See API Access → Pagination.
Records
Total number of domain records returned across all queries in the selected time range. Useful for understanding the overall volume of data you've pulled.
API Keys
The number of API keys currently active on your account. Click through to the API Keys section lower on the page to see them listed individually.
Plan Capability Strip
Just below the KPI tiles, a horizontal strip shows the capabilities your plan currently grants:
| Chip | Meaning |
|---|---|
| Wildcard | Wildcard searches (*) are enabled on your plan |
| Browse all | Browse-without-filter is enabled on your plan |
<N> rec/query |
Maximum records returned per query (e.g. 10,000 rec/query) |
<N>d window |
Historical data window for queries (e.g. 180d window) |
These reflect the limits documented in the Subscription Guide. Trial users will see fewer chips since some features (Wildcard, Browse all) are not available on the Trial plan.
Query Activity Chart
A time-series line chart showing your daily query volume across the selected time range.
- X axis — date
- Y axis — number of queries executed on that day
- Hovering on any point reveals the exact count for that day
Use this chart to spot usage spikes, identify quiet periods, or detect unexpected automated activity from misconfigured integrations.
Top TLDs
A horizontal bar chart showing which TLDs you've queried the most during the selected time range.
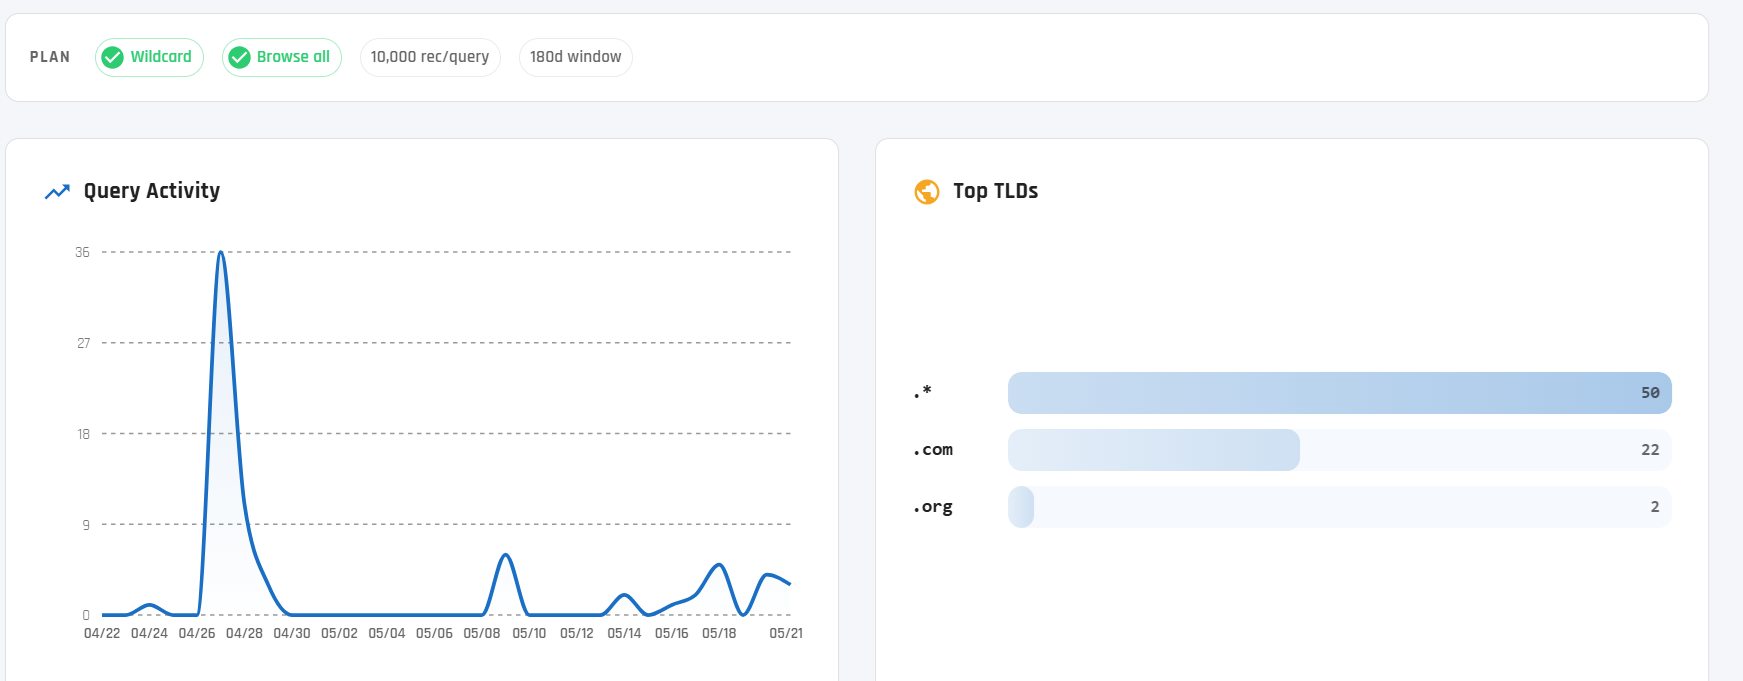
.*indicates wildcard / cross-TLD queries- Specific TLDs (e.g.
.com,.org) are listed individually - Bars are ranked by query count
This panel is useful for spotting whether your investigations are focused or broad, and for confirming that wildcard queries are being used as expected.
API Keys
Expand this section to view the API keys associated with your account.

Typical information shown per key includes:
- Key name
- Creation date and expiry date
- Last-used timestamp
- Active/expired status
For details on creating, listing, and revoking API keys, see the API Access Guide and API Reference.
Subscription History
Expand this section to see a chronological record of changes to your subscription — plan upgrades, downgrades, renewals, cancellations, and trial activations.
This is the authoritative timeline for your billing relationship with ZoneFeeds and is useful when reconciling PayPal receipts or confirming when plan changes took effect.
Query History
A paginated, searchable table of every query you've run in the selected time range.
Columns
| Column | Description |
|---|---|
| Time | Timestamp the query was executed |
| TLD | The TLD targeted (e.g. .com) or .* for cross-TLD wildcard queries |
| Search | The search term used (e.g. google, *google*) |
| Records | Number of records returned by the query |
| Via | The source/origin of the request |
The total query count for the selected range is shown at the top of the table
(e.g. 274 total). Results are paginated — use the page controls at the
bottom to navigate.
Tip: Pair the Query History with the Top TLDs chart to audit unusual patterns — a sudden burst of records returned from a TLD you don't normally query can be the first signal of credential misuse.
Use Cases
- Quota management — keep an eye on monthly consumption to avoid hitting the limit before your reset date
- Capacity planning — review 30-day trends to decide whether to upgrade from Basic to Enterprise
- Audit and compliance — reconcile query history against internal investigation records
- Anomaly detection — spot unexpected spikes that may indicate a leaked API key or runaway automation
- Billing verification — cross-check Subscription History against PayPal receipts
Notes
- Usage data is retained for one month, after which it is automatically deleted (see Terms & Conditions)
- The dashboard reflects activity from both the web UI and API — they share the same quota
- Cursor pagination requests are not counted in any of the KPIs since they don't consume quota